IBOV 185,992.03 ▲ 0.24% IPSA 11,381.18 ▲ 1.30% IPC MEX 63,684.18 ▲ 0.28% MERVAL 3,061,512 ▲ 1.08% COLCAP 2,521.85 ▲ 0.40% BVL PERÚ 58,965.05 ▲ 1.80% USD/BRL5.12▼ 0.57% USD/MXN17.15▼ 0.56% USD/CLP960.65▲ 0.54% USD/COP3,165▲ 1.37% USD/PEN3.37▲ 0.44% USD/ARS1,510▼ 0.21% USD/UYU40.20▲ 3.11% USD/PYG5,888▲ 2.09% USD/BOB9.75▼ 12.91% USD/DOP58.80▼ 0.09% USD/CRC444.45▲ 2.53% USD/GTQ7.63▲ 3.11% USD/HNL26.85▲ 3.22% USD/NIO36.62▲ 2.69% USD/VES845.33▼ 0.13% USD/PAB1.00— 0.00% USD/BZD2.00— 0.00% USD/JMD 157.28 — 0.00% USD/TTD6.74▲ 2.56% EUR/BRL5.88▼ 0.79% BRENT 88.88 ▼ 0.03% WTI 83.11 ▼ 0.11% IRON ORE 161.91 — — COPPER 6.61 ▲ 0.03% GOLD 4,461 ▲ 1.78% SILVER 65.59 ▲ 1.26% SOY 1,184 ▲ 3.20% CORN 480.50 ▲ 10.02% WHEAT 655.00 ▲ 3.93% COFFEE 317.25 ▼ 5.51% SUGAR 16.43 ▼ 1.79% ORANGE JUICE 138.55 ▼ 0.47% COTTON 85.03 ▲ 2.33% COCOA 5,719 ▲ 3.18% BEEF 223.60 ▼ 3.93% CATTLE 339.10 ▼ 3.16% LITHIUM 75.20 ▲ 1.47% PETR4 41.64 ▼ 0.05% VALE3 72.97 ▲ 0.83% ITUB4 38.60 ▼ 1.03% BBDC4 16.85 ▲ 0.36% ABEV3 14.89 ▼ 0.80% BBAS3 19.37 ▲ 0.47% B3SA3 14.26 ▼ 0.21% WEGE3 47.59 ▲ 0.49% PRIO3 59.14 ▼ 0.19% SUZB3 41.33 ▲ 2.35% RENT3 34.68 ▼ 0.09% AZZA3 15.89 ▼ 2.63% CSAN3 3.22 ▼ 1.83% RAIZ4 0.25 — 0.00% PCAR3 2.75 ▼ 0.36% GMAT3 3.65 ▼ 1.08% PSSA3 48.13 ▼ 0.54% CVCB3 1.33 ▼ 2.92% POSI3 3.36 ▲ 2.44% SLCE3 13.34 ▲ 0.30% NATU3 8.14 ▼ 0.73% IBOV 185,992.03 ▲ 0.24% IPSA 11,381.18 ▲ 1.30% IPC MEX 63,684.18 ▲ 0.28% MERVAL 3,061,512 ▲ 1.08% COLCAP 2,521.85 ▲ 0.40% BVL PERÚ 58,965.05 ▲ 1.80% USD/BRL 5.16 ▲ 0.01% USD/MXN 17.06 ▼ 0.24% USD/CLP 913.98 ▲ 0.04% USD/COP 3,140 ▲ 0.03% USD/PEN 3.36 ▼ 0.66% USD/ARS 1,493 ▲ 0.10% USD/UYU 40.27 ▲ 1.24% USD/PYG 5,939 ▲ 1.68% USD/BOB 11.64 ▼ 0.76% USD/DOP 58.34 ▲ 1.25% USD/CRC 445.92 ▲ 0.89% USD/GTQ 7.62 ▲ 2.21% USD/HNL 26.79 ▲ 1.57% USD/NIO 36.62 ▲ 0.69% USD/VES 762.44 ▼ 0.13% USD/PAB 1.00 — 0.00% USD/BZD 2.00 — 0.00% USD/JMD 157.28 — 0.00% USD/TTD 6.70 ▲ 0.61% EUR/BRL 5.95 ▲ 1.01% BRENT 88.88 ▼ 0.03% WTI 83.11 ▼ 0.11% IRON ORE 161.91 — — COPPER 6.61 ▲ 0.03% GOLD 4,461 ▲ 1.78% SILVER 65.59 ▲ 1.26% SOY 1,184 ▲ 3.20% CORN 480.50 ▲ 10.02% WHEAT 655.00 ▲ 3.93% COFFEE 317.25 ▼ 5.51% SUGAR 16.43 ▼ 1.79% ORANGE JUICE 138.55 ▼ 0.47% COTTON 85.03 ▲ 2.33% COCOA 5,719 ▲ 3.18% BEEF 223.60 ▼ 3.93% CATTLE 339.10 ▼ 3.16% LITHIUM 75.20 ▲ 1.47% PETR4 41.64 ▼ 0.05% VALE3 72.97 ▲ 0.83% ITUB4 38.60 ▼ 1.03% BBDC4 16.85 ▲ 0.36% ABEV3 14.89 ▼ 0.80% BBAS3 19.37 ▲ 0.47% B3SA3 14.26 ▼ 0.21% WEGE3 47.59 ▲ 0.49% PRIO3 59.14 ▼ 0.19% SUZB3 41.33 ▲ 2.35% RENT3 34.68 ▼ 0.09% AZZA3 15.89 ▼ 2.63% CSAN3 3.22 ▼ 1.83% RAIZ4 0.25 — 0.00% PCAR3 2.75 ▼ 0.36% GMAT3 3.65 ▼ 1.08% PSSA3 48.13 ▼ 0.54% CVCB3 1.33 ▼ 2.92% POSI3 3.36 ▲ 2.44% SLCE3 13.34 ▲ 0.30% NATU3 8.14 ▼ 0.73%
since 2009
Friday, September 18, 2026

Latest News Life & Society

Growth and Decline: Tracking São Paulo’s Population Trends

By · March 21, 2024 · 2 min read

The LatAm Brief

One email, every weekday morning. What moved in Latin American markets, politics and expat life.

Yesterday’s subject line: “The Fed raised. Brazil cut, four hours later.”

Free. We send a confirmation link first — nothing arrives until you click it. Unsubscribe with one click in any edition. If you stop opening us for 30 days we stop sending by ourselves, as we assume the interest is no longer there. See our privacy policy. We never share your email.

São Paulo’s Barra Funda district in the city center witnessed a remarkable doubling of its population within ten years.

However, the Paraisópolis favela, another district, saw the most substantial numeric growth, adding 41,000 residents.

Despite an overall modest increase of 0.15% in São Paulo’s population over a decade.

The 2022 Census of the Brazilian stats agency IBGE unveiled considerable shifts among neighborhoods of the Southern Hemisphere’s largest city.

Despite a surge in real estate projects, Bela Vista’s population declined by more than 10%, keeping it densely populated.

On the other hand, Brasilândia and several eastern districts observed significant reductions in inhabitants, with Brasilândia alone losing 21,000 people.
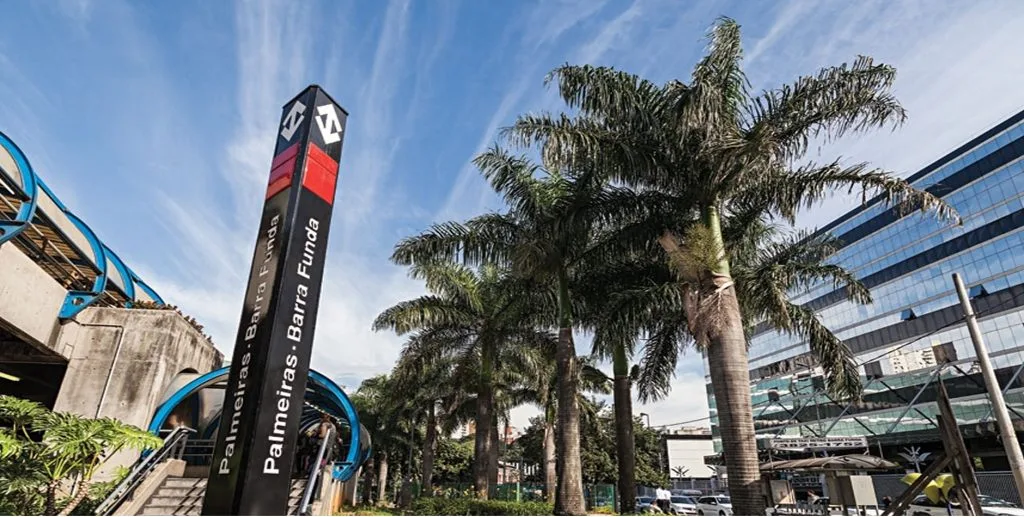
Growth and Decline: Tracking São Paulo's Population Trends.
Growth and Decline: Tracking São Paulo’s Population Trends.
One-stop reference
Company Intelligence
Every listed company in Latin America — financials, ownership and structure for 1,450+ companies across 26 exchanges, in one place.
Browse the directory →
RT
Ask Rio Times
17 years of Latin America reporting, on demand.
Open the full Ask Rio Times →

The census also shed light on alterations in the city’s population density. The Republic district remains the densest, housing 26,000 people per square kilometer.

However, notable changes have occurred within the central region defined by the Tietê and Pinheiros rivers.

Still, 14% of São Paulo’s territory remains uninhabited, primarily comprising parks, conservation areas, and water bodies.

The city is undergoing a transformation, particularly evident in districts like Barra Funda, Vila Leopoldina, and Santo Amaro, which have seen a flurry of new constructions.

This shift towards more vertical living spaces is anticipated to become more apparent as more detailed census data on household types by district become available.

Moreover, the census highlights São Paulo’s housing dilemma, accentuated by a migration trend from the city’s southern regions towards the center.

The Grajaú district leads in the number of vacant homes, a trend also pronounced in Marsilac, where 35% of houses are empty.

Addressing the city’s housing deficit, estimated by municipal authorities at 400,000 units, is imperative for crafting future public policies.

This article was produced by The Rio Times’ automated newsroom system. How we use AI · Report an error

Read More from The Rio Times

The Rio Times · Power Map
See who really holds power in Latin America
Click to open the Power Map

Rotate for Best Experience

This report is optimized for landscape viewing. Rotate your phone for the full experience.