IBOV 187,366.84 ▲ 1.20% IPSA 11,315.26 ▼ 1.14% IPC MEX 65,010.39 ▲ 0.44% MERVAL 3,075,982 ▲ 1.36% COLCAP 2,569.47 ▲ 0.15% BVL PERÚ 59,620.96 ▲ 1.05% USD/BRL5.09▼ 0.72% USD/MXN16.91▼ 0.03% USD/CLP924.74▼ 1.05% USD/COP3,105▼ 0.76% USD/PEN3.35▼ 0.18% USD/ARS1,512▼ 0.02% USD/UYU40.22▲ 1.23% USD/PYG5,892▲ 0.36% USD/BOB12.45▲ 2.03% USD/DOP58.50▼ 0.01% USD/CRC446.50▲ 1.13% USD/GTQ7.64▲ 2.32% USD/HNL26.84▲ 1.63% USD/NIO36.62▲ 0.69% USD/VES818.05▲ 0.54% USD/PAB1.00— 0.00% USD/BZD2.00— 0.00% USD/JMD 157.28 — 0.00% USD/TTD6.71▲ 1.03% EUR/BRL5.92▼ 0.51% BRENT 88.88 ▼ 0.03% WTI 83.11 ▼ 0.11% IRON ORE 161.91 — — COPPER 6.61 ▲ 0.03% GOLD 4,461 ▲ 1.78% SILVER 65.59 ▲ 1.26% SOY 1,184 ▲ 3.20% CORN 480.50 ▲ 10.02% WHEAT 655.00 ▲ 3.93% COFFEE 317.25 ▼ 5.51% SUGAR 16.43 ▼ 1.79% ORANGE JUICE 138.55 ▼ 0.47% COTTON 85.03 ▲ 2.33% COCOA 5,719 ▲ 3.18% BEEF 223.60 ▼ 3.93% CATTLE 339.10 ▼ 3.16% LITHIUM 75.20 ▲ 1.47% PETR4 41.64 ▼ 0.05% VALE3 72.97 ▲ 0.83% ITUB4 38.60 ▼ 1.03% BBDC4 16.85 ▲ 0.36% ABEV3 14.89 ▼ 0.80% BBAS3 19.37 ▲ 0.47% B3SA3 14.26 ▼ 0.21% WEGE3 47.59 ▲ 0.49% PRIO3 59.14 ▼ 0.19% SUZB3 41.33 ▲ 2.35% RENT3 34.68 ▼ 0.09% AZZA3 15.89 ▼ 2.63% CSAN3 3.22 ▼ 1.83% RAIZ4 0.25 — 0.00% PCAR3 2.75 ▼ 0.36% GMAT3 3.65 ▼ 1.08% PSSA3 48.13 ▼ 0.54% CVCB3 1.33 ▼ 2.92% POSI3 3.36 ▲ 2.44% SLCE3 13.34 ▲ 0.30% NATU3 8.14 ▼ 0.73% IBOV 187,366.84 ▲ 1.20% IPSA 11,315.26 ▼ 1.14% IPC MEX 65,010.39 ▲ 0.44% MERVAL 3,075,982 ▲ 1.36% COLCAP 2,569.47 ▲ 0.15% BVL PERÚ 59,620.96 ▲ 1.05% USD/BRL 5.16 ▲ 0.01% USD/MXN 17.06 ▼ 0.24% USD/CLP 913.98 ▲ 0.04% USD/COP 3,140 ▲ 0.03% USD/PEN 3.36 ▼ 0.66% USD/ARS 1,493 ▲ 0.10% USD/UYU 40.27 ▲ 1.24% USD/PYG 5,939 ▲ 1.68% USD/BOB 11.64 ▼ 0.76% USD/DOP 58.34 ▲ 1.25% USD/CRC 445.92 ▲ 0.89% USD/GTQ 7.62 ▲ 2.21% USD/HNL 26.79 ▲ 1.57% USD/NIO 36.62 ▲ 0.69% USD/VES 762.44 ▼ 0.13% USD/PAB 1.00 — 0.00% USD/BZD 2.00 — 0.00% USD/JMD 157.28 — 0.00% USD/TTD 6.70 ▲ 0.61% EUR/BRL 5.95 ▲ 1.01% BRENT 88.88 ▼ 0.03% WTI 83.11 ▼ 0.11% IRON ORE 161.91 — — COPPER 6.61 ▲ 0.03% GOLD 4,461 ▲ 1.78% SILVER 65.59 ▲ 1.26% SOY 1,184 ▲ 3.20% CORN 480.50 ▲ 10.02% WHEAT 655.00 ▲ 3.93% COFFEE 317.25 ▼ 5.51% SUGAR 16.43 ▼ 1.79% ORANGE JUICE 138.55 ▼ 0.47% COTTON 85.03 ▲ 2.33% COCOA 5,719 ▲ 3.18% BEEF 223.60 ▼ 3.93% CATTLE 339.10 ▼ 3.16% LITHIUM 75.20 ▲ 1.47% PETR4 41.64 ▼ 0.05% VALE3 72.97 ▲ 0.83% ITUB4 38.60 ▼ 1.03% BBDC4 16.85 ▲ 0.36% ABEV3 14.89 ▼ 0.80% BBAS3 19.37 ▲ 0.47% B3SA3 14.26 ▼ 0.21% WEGE3 47.59 ▲ 0.49% PRIO3 59.14 ▼ 0.19% SUZB3 41.33 ▲ 2.35% RENT3 34.68 ▼ 0.09% AZZA3 15.89 ▼ 2.63% CSAN3 3.22 ▼ 1.83% RAIZ4 0.25 — 0.00% PCAR3 2.75 ▼ 0.36% GMAT3 3.65 ▼ 1.08% PSSA3 48.13 ▼ 0.54% CVCB3 1.33 ▼ 2.92% POSI3 3.36 ▲ 2.44% SLCE3 13.34 ▲ 0.30% NATU3 8.14 ▼ 0.73%
since 2009
Wednesday, September 9, 2026

Africa Lusophone World

Cabo Verde’s Remarkable Stand in Corruption Control

By · January 30, 2024 · 2 min read

Africa Intelligence

One email, every weekday morning. African markets, politics and business — filed from our newsroom in Rio.

Yesterday’s subject line: “China's Africa lending fell 46% in one year”

Free. We send a confirmation link first — nothing arrives until you click it. Unsubscribe with one click in any edition. If you stop opening us for 30 days we stop sending by ourselves, as we assume the interest is no longer there. See our privacy policy. We never share your email.

Transparency International’s report ranks Cape Verde second only to Seychelles in fighting corruption in Sub-Saharan Africa.

Ranking 31st among 180 nations, Cape Verde’s position is noteworthy.

This year’s Corruption Perceptions Index (CPI), formulated by Transparency International, awards Cape Verde 64 points.

The scale ranges from zero, indicating high corruption, to 100, signifying utmost transparency.

Cape Verde’s government recently passed a law to create an online system for judicial processes.

This move aims to minimize case backlogs and delays, showcasing an active stance in promoting transparency.
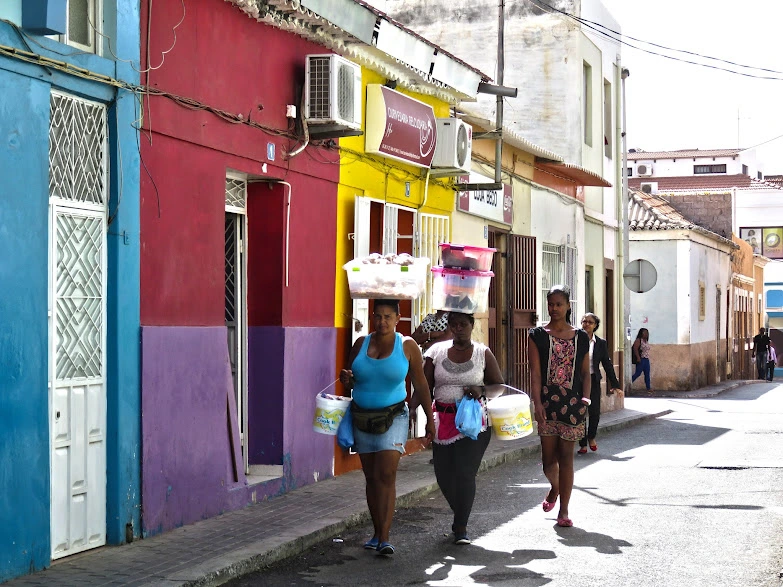
Cabo Verde's Remarkable Stand in Corruption Control.
Cabo Verde’s Remarkable Stand in Corruption Control.
One-stop reference
Company Intelligence
Every listed company in Latin America — financials, ownership and structure for 1,450+ companies across 26 exchanges, in one place.
Browse the directory →
RT
Ask Rio Times
17 years of Latin America reporting, on demand.
Open the full Ask Rio Times →

Over five years, Cape Verde’s CPI score has risen by six points. Extending the timeline to 11 years reveals an overall four-point improvement.

Transparency International introduced the CPI in 1995, establishing it as a key metric for assessing corruption trends.

It evaluates public sector corruption through insights from industry experts and business leaders.

The CPI is a composite index that integrates multiple independent analyses of corruption.

A significant revision in 2012 updated the CPI’s methodology. This adjustment ensures consistent comparison of annual scores.

This development in Cape Verde’s corruption perception underscores its governance and public sector integrity progress.

It reflects a broader commitment to transparency and ethical practices.

Such achievements are crucial for fostering trust in government institutions and supporting overall societal progress.

Background

Transparency International’s report showcases a stark contrast in corruption perception between Cape Verde and Brazil.

Cape Verde ranks as the second least corrupt nation in Sub-Saharan Africa and 31st globally, scoring 64 out of 100.

This marks a significant rise, reflecting improvements over the past five years.

Brazil, on the other hand, has seen a decline. It now ranks 104th with a score of 36, a two-point drop from the previous year.

This positions Brazil below both global and American averages, comparable to Ukraine, Algeria, and Serbia, but lower than Ethiopia and Belarus.

This article was produced by The Rio Times’ automated newsroom system. How we use AI · Report an error

Part of our ongoing coverage

Africa: The New Scramble — the great-power contest over the continent.

More from Western Africa

Read More from The Rio Times

The Rio Times · Power Map
See who really holds power in Latin America
Click to open the Power Map

Rotate for Best Experience

This report is optimized for landscape viewing. Rotate your phone for the full experience.