IBOV 166,934.20 ▼ 0.10% IPSA 11,042.67 ▲ 0.39% IPC MEX 64,397.45 ▼ 0.66% MERVAL 2,947,349 ▼ 1.77% COLCAP 2,452.46 ▲ 0.84% BVL PERÚ 58,104.31 ▲ 0.40% USD/BRL5.21▼ 0.01% USD/MXN17.02▼ 0.01% USD/CLP914.45▼ 0.02% USD/COP3,134▼ 0.25% USD/PEN3.37▼ 0.01% USD/ARS1,488— 0.00% USD/UYU40.33— 0.00% USD/PYG5,984— 0.00% USD/BOB11.54— 0.00% USD/DOP58.45— 0.00% USD/CRC446.12— 0.00% USD/GTQ7.62— 0.00% USD/HNL26.79— 0.00% USD/NIO36.62— 0.00% USD/VES769.14▼ 0.32% USD/PAB1.00— 0.00% USD/BZD2.00— 0.00% USD/JMD 157.28 — 0.00% USD/TTD6.70— 0.00% EUR/BRL6.05▲ 1.03% BRENT 88.88 ▼ 0.03% WTI 83.11 ▼ 0.11% IRON ORE 161.91 — — COPPER 6.61 ▲ 0.03% GOLD 4,461 ▲ 1.78% SILVER 65.59 ▲ 1.26% SOY 1,184 ▲ 3.20% CORN 480.50 ▲ 10.02% WHEAT 655.00 ▲ 3.93% COFFEE 317.25 ▼ 5.51% SUGAR 16.43 ▼ 1.79% ORANGE JUICE 138.55 ▼ 0.47% COTTON 85.03 ▲ 2.33% COCOA 5,719 ▲ 3.18% BEEF 223.60 ▼ 3.93% CATTLE 339.10 ▼ 3.16% LITHIUM 75.20 ▲ 1.47% PETR4 41.64 ▼ 0.05% VALE3 72.97 ▲ 0.83% ITUB4 38.60 ▼ 1.03% BBDC4 16.85 ▲ 0.36% ABEV3 14.89 ▼ 0.80% BBAS3 19.37 ▲ 0.47% B3SA3 14.26 ▼ 0.21% WEGE3 47.59 ▲ 0.49% PRIO3 59.14 ▼ 0.19% SUZB3 41.33 ▲ 2.35% RENT3 34.68 ▼ 0.09% AZZA3 15.89 ▼ 2.63% CSAN3 3.22 ▼ 1.83% RAIZ4 0.25 — 0.00% PCAR3 2.75 ▼ 0.36% GMAT3 3.65 ▼ 1.08% PSSA3 48.13 ▼ 0.54% CVCB3 1.33 ▼ 2.92% POSI3 3.36 ▲ 2.44% SLCE3 13.34 ▲ 0.30% NATU3 8.14 ▼ 0.73% IBOV 166,934.20 ▼ 0.10% IPSA 11,042.67 ▲ 0.39% IPC MEX 64,397.45 ▼ 0.66% MERVAL 2,947,349 ▼ 1.77% COLCAP 2,452.46 ▲ 0.84% BVL PERÚ 58,104.31 ▲ 0.40% USD/BRL 5.16 ▲ 0.01% USD/MXN 17.06 ▼ 0.24% USD/CLP 913.98 ▲ 0.04% USD/COP 3,140 ▲ 0.03% USD/PEN 3.36 ▼ 0.66% USD/ARS 1,493 ▲ 0.10% USD/UYU 40.27 ▲ 1.24% USD/PYG 5,939 ▲ 1.68% USD/BOB 11.64 ▼ 0.76% USD/DOP 58.34 ▲ 1.25% USD/CRC 445.92 ▲ 0.89% USD/GTQ 7.62 ▲ 2.21% USD/HNL 26.79 ▲ 1.57% USD/NIO 36.62 ▲ 0.69% USD/VES 762.44 ▼ 0.13% USD/PAB 1.00 — 0.00% USD/BZD 2.00 — 0.00% USD/JMD 157.28 — 0.00% USD/TTD 6.70 ▲ 0.61% EUR/BRL 5.95 ▲ 1.01% BRENT 88.88 ▼ 0.03% WTI 83.11 ▼ 0.11% IRON ORE 161.91 — — COPPER 6.61 ▲ 0.03% GOLD 4,461 ▲ 1.78% SILVER 65.59 ▲ 1.26% SOY 1,184 ▲ 3.20% CORN 480.50 ▲ 10.02% WHEAT 655.00 ▲ 3.93% COFFEE 317.25 ▼ 5.51% SUGAR 16.43 ▼ 1.79% ORANGE JUICE 138.55 ▼ 0.47% COTTON 85.03 ▲ 2.33% COCOA 5,719 ▲ 3.18% BEEF 223.60 ▼ 3.93% CATTLE 339.10 ▼ 3.16% LITHIUM 75.20 ▲ 1.47% PETR4 41.64 ▼ 0.05% VALE3 72.97 ▲ 0.83% ITUB4 38.60 ▼ 1.03% BBDC4 16.85 ▲ 0.36% ABEV3 14.89 ▼ 0.80% BBAS3 19.37 ▲ 0.47% B3SA3 14.26 ▼ 0.21% WEGE3 47.59 ▲ 0.49% PRIO3 59.14 ▼ 0.19% SUZB3 41.33 ▲ 2.35% RENT3 34.68 ▼ 0.09% AZZA3 15.89 ▼ 2.63% CSAN3 3.22 ▼ 1.83% RAIZ4 0.25 — 0.00% PCAR3 2.75 ▼ 0.36% GMAT3 3.65 ▼ 1.08% PSSA3 48.13 ▼ 0.54% CVCB3 1.33 ▼ 2.92% POSI3 3.36 ▲ 2.44% SLCE3 13.34 ▲ 0.30% NATU3 8.14 ▼ 0.73%
since 2009
Sunday, August 16, 2026

Agri Business Business - Brazil

Brazilian Soy and Corn Exports in March 2024: Significant Yet Declining

By · April 14, 2024 · 2 min read

Daily Brief

The morning intel from across Latin America. Free.

By subscribing you agree to our privacy policy. We never share your email.

In March 2024, Brazil’s soy and corn exports totaled 14.8 million tons, down 14.6% yet still the second-highest March on record.

The Farming Ministry MAPA noted that soybeans accounted for 14.4 million tons of the exports, whereas corn contributed 430,000 tons.

Despite the overall decline, these numbers still signify a robust role in the global agricultural market.

The Northern Arc ports, such as Itacoatiara, Santarém, Santana, São Luiz, Barcarena/Vila do Conde, and Salvador, were key in managing exports.

They handled 31.6% of the total exports, an increase from 27.3% in 2020. This underscores their increasing significance in Brazil’s export infrastructure.

From January to March, Brazil’s total grain exports surged to 34.3 million tons, a 3% increase from the same period in 2023 and a 47% jump from 2020.
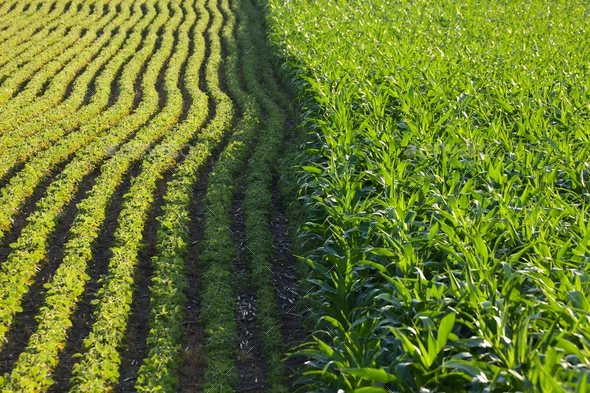
Brazilian Soy and Corn Exports in March 2024: Significant Yet Declining. (Photo Internet reproduction)
One-stop reference
Company Intelligence
Every listed company in Latin America — financials, ownership and structure for 1,450+ companies across 26 exchanges, in one place.
Browse the directory →
RT
Ask Rio Times
Latin American markets, currencies and companies.
Open the full Ask Rio Times →

Soy exports saw a 31% rise to 27.3 million tons, whereas corn exports fell by 27.8% to 7 million tons.

Grain distribution experienced a strategic adjustment; 11.5 million tons passed through the Northern Arc.

Meanwhile, traditional Southern Arc ports like Santos and Paranaguá managed 22.8 million tons.

This shift takes advantage of the closer location of Northern ports to major farming areas such as Mato Grosso and the Matopiba region.

It significantly enhances the efficiency of logistics operations.

Furthermore, the adoption of intermodal transport in the North, which integrates road, waterway, and rail, has boosted export competitiveness.

It has also substantially lowered the costs of transportation.

This holistic strategy is transforming the way Brazil handles its agricultural exports. It is advancing efficiency and sustainability in the country’s trade practices.

This article was produced by The Rio Times’ automated newsroom system. How we use AI · Report an error

Read More from The Rio Times

The Rio Times · Power Map
See who really holds power in Latin America
Click to open the Power Map

Rotate for Best Experience

This report is optimized for landscape viewing. Rotate your phone for the full experience.