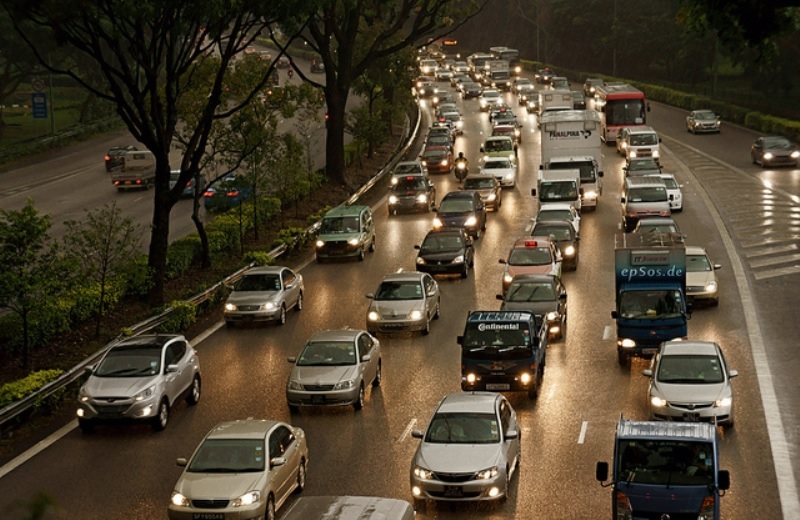
RIO DE JANEIRO, BRAZIL – Residents of Brazilian capitals spend an average of two hours a day in traffic. In the year as a whole, 21 days are spent exclusively in front of the steering wheel or on public transportation.
The data are from the Urban Mobility Research 2022 carried out in partnership with CNDL (National Confederation of Store Managers), SPC (Credit Protection Service), and Sebrae.
Compared with the survey done in 2017, however, there was a reduction of 28 minutes of the daily traffic journey.
In percentage numbers, the amount of time in traffic among respondents in 2022 was:
- From 30 minutes to one hour: 28%;
- From one to two hours: 32%;
- More than two hours: 29%.
For the president of the CNDL, José César da Costa, the pandemic contributed to a behavioral change in urban locomotion.
“The decrease in time in traffic, pointed out by the survey, is a reflection of this, since many companies started using the hybrid [work] model even after the pandemic was controlled,” said Costa.
PUBLIC TRANSPORTATION
The use of buses, subways, and trains is preferred because of the lower cost for 48% of the interviewees. Another 31% mentioned the possibility of saving money, while 29% cited that it is the only available means of transportation. Ease of access (26%), agility (15%), and convenience (12%) were also mentioned.
The average waiting time for a ride is 23.7 minutes, with 40% of the users waiting between 15 and 30 minutes to board.
In the evaluation of the quality of the service, the positive highlight was the service provided by the driver or exchanger, considered good or excellent by 44%. On the other hand, the main complaints are related to the fare and safety for 68% and 53% of the passengers, respectively.
Other negative points mentioned by the users were:
- Comfort (50%);
- Vehicle maintenance (46%);
- Punctuality (45%).
The prioritization of exclusive lanes and corridors for buses is beneficial in the opinion of 69%, while 83% agreed with the closing of streets and avenues for the exclusive use of pedestrians and cyclists on Sundays.
MEANS OF TRANSPORTATION
The bus is the most used transportation in Brazilian capitals for daily commuting, with 50% of the mentions. It is followed by the car (32%), walking (22%), transport applications (16%), and motorcycle and subway, both with 11%.
For those who commute by foot, urban lighting is an essential factor in choosing this means for 79%, with 70% saying they do not feel safe walking where they live.
Regarding the conservation status of bike lanes and paths, 57% considered the structure in their city adequate, against 39% who judged it inadequate.
The survey shows that transportation apps have become popular in the capitals, with 6 out of 10 users reporting using these services or cabs. The apps were rated good or excellent mainly for comfort (77%), travel time (72%), vehicle maintenance (71%), driver service (69%), and cleanliness (69%). The fare was criticized by 20%.
REMOTE WORK
The possibility of maintaining the home office regime is approved by 68% of the users who reported working at least three days at home. There are 17% who said they work this way.
For José César da Costa, despite the hybrid model favoring the “mobility and well-being of the workers who may join,” this is not enough “as a solution for big cities, which still lack investment in public transportation”.
The distance to get to work, by the way, was a problem for 42% of the interviewees. Including the displacement for leisure or other activities, 27% stopped going somewhere or went on foot for lack of money, and 26% couldn’t find any transportation available on time.
With information from Poder360