RIO DE JANEIRO, BRAZIL – The northern and western districts of Rio record the highest concentration of Covid-19 infection. A study by the ‘Instituto d’Or de Pesquisa e Ensino’ (D’Or Institute for Research and Education – IDOR) in partnership with private company Zoox Smart Data, conducted between late April and last Monday, June 15th, points this out.

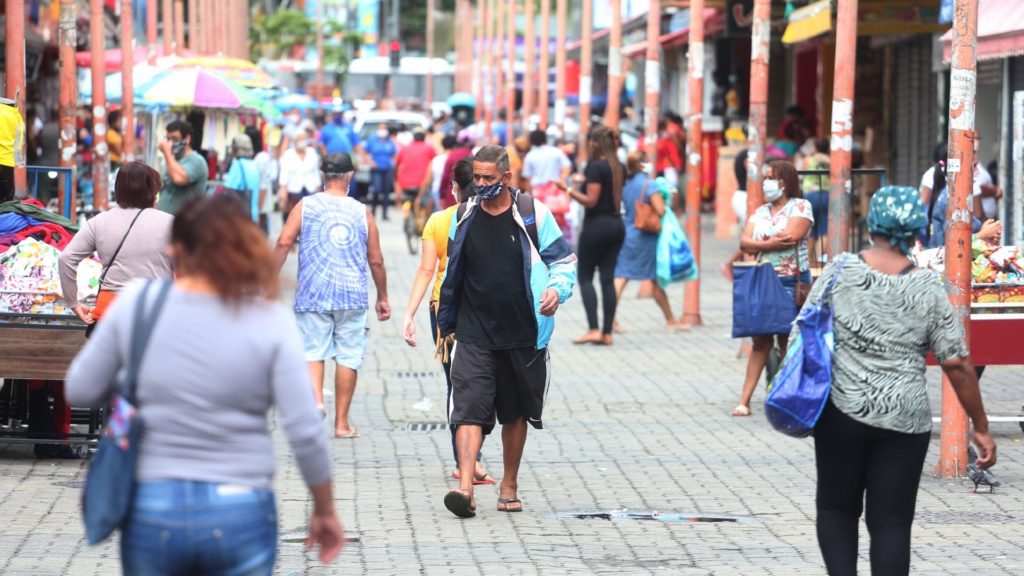
The neighborhoods of Bangu, Campo Grande, and Santa Cruz, in the West Zone of Rio de Janeiro, are among the leaders in crowding in the state capital, according to data from ‘Disk Aglomeração’, a city hall service where the population can denounce non-compliance with measures to fight Coronavirus.
Based on 24,485 tests conducted in the capital with users of ‘Data do Bem’ App, the survey showed that Copacabana, leader in the number of coronavirus cases, has about one positive result for every ten tests, while Barros Filho has one confirmed positive for every two cases, i.e., an infection rate of 54.29 percent.
While the average rate of infection in the capital stands at 13.9 percent, some regions record much higher percentages, among them Engenheiro Leal (40 percent), Colégio (35.9 percent), Vaz Lobo (35.71 percent) and Guadalupe (33.3 percent). In the West Zone, neighborhoods such as Pedra de Guaratiba (35.71 percent) and Senador Camará (35.04 percent) complete the list.
As for the South Zone, the highest rate of infection is found in Flamengo, where 17.4 percent of tests for Covid-19 analyzed came back positive. In Copacabana, leader in confirmed cases, with 1979 infections, the rate stands at 10.16 percent.
At the start of the pandemic, the city of Rio de Janeiro’s municipal government launched an online panel that showed not only the number of cases and daily deaths caused by Covid-19, but also other details. Among them was the number of cases per neighborhood, which helped map the areas of highest infection, according to experts. However, with no explanation, the data were subsequently removed.

