IBOV 187,958.63 ▲ 1.25% IPSA 11,300.24 ▼ 0.62% IPC MEX 64,479.96 ▼ 0.52% MERVAL 3,142,643 ▲ 1.04% COLCAP 2,600.18 ▲ 0.63% BVL PERÚ 60,702.89 ▼ 2.17% USD/BRL5.10▼ 0.20% USD/MXN16.99▲ 0.58% USD/CLP940.57▲ 1.39% USD/COP3,081▼ 1.14% USD/PEN3.36▲ 0.13% USD/ARS1,513▼ 0.08% USD/UYU40.24▲ 3.05% USD/PYG5,868▲ 2.26% USD/BOB12.36▲ 1.91% USD/DOP58.60▲ 0.17% USD/CRC447.58▲ 1.69% USD/GTQ7.63▲ 3.04% USD/HNL26.85▲ 0.57% USD/NIO36.62▲ 0.34% USD/VES825.67▼ 0.13% USD/PAB1.00— 0.00% USD/BZD2.00— 0.00% USD/JMD 157.28 — 0.00% USD/TTD6.73▲ 2.40% EUR/BRL5.92▲ 0.23% BRENT 88.88 ▼ 0.03% WTI 83.11 ▼ 0.11% IRON ORE 161.91 — — COPPER 6.61 ▲ 0.03% GOLD 4,461 ▲ 1.78% SILVER 65.59 ▲ 1.26% SOY 1,184 ▲ 3.20% CORN 480.50 ▲ 10.02% WHEAT 655.00 ▲ 3.93% COFFEE 317.25 ▼ 5.51% SUGAR 16.43 ▼ 1.79% ORANGE JUICE 138.55 ▼ 0.47% COTTON 85.03 ▲ 2.33% COCOA 5,719 ▲ 3.18% BEEF 223.60 ▼ 3.93% CATTLE 339.10 ▼ 3.16% LITHIUM 75.20 ▲ 1.47% PETR4 41.64 ▼ 0.05% VALE3 72.97 ▲ 0.83% ITUB4 38.60 ▼ 1.03% BBDC4 16.85 ▲ 0.36% ABEV3 14.89 ▼ 0.80% BBAS3 19.37 ▲ 0.47% B3SA3 14.26 ▼ 0.21% WEGE3 47.59 ▲ 0.49% PRIO3 59.14 ▼ 0.19% SUZB3 41.33 ▲ 2.35% RENT3 34.68 ▼ 0.09% AZZA3 15.89 ▼ 2.63% CSAN3 3.22 ▼ 1.83% RAIZ4 0.25 — 0.00% PCAR3 2.75 ▼ 0.36% GMAT3 3.65 ▼ 1.08% PSSA3 48.13 ▼ 0.54% CVCB3 1.33 ▼ 2.92% POSI3 3.36 ▲ 2.44% SLCE3 13.34 ▲ 0.30% NATU3 8.14 ▼ 0.73% IBOV 187,958.63 ▲ 1.25% IPSA 11,300.24 ▼ 0.62% IPC MEX 64,479.96 ▼ 0.52% MERVAL 3,142,643 ▲ 1.04% COLCAP 2,600.18 ▲ 0.63% BVL PERÚ 60,702.89 ▼ 2.17% USD/BRL 5.16 ▲ 0.01% USD/MXN 17.06 ▼ 0.24% USD/CLP 913.98 ▲ 0.04% USD/COP 3,140 ▲ 0.03% USD/PEN 3.36 ▼ 0.66% USD/ARS 1,493 ▲ 0.10% USD/UYU 40.27 ▲ 1.24% USD/PYG 5,939 ▲ 1.68% USD/BOB 11.64 ▼ 0.76% USD/DOP 58.34 ▲ 1.25% USD/CRC 445.92 ▲ 0.89% USD/GTQ 7.62 ▲ 2.21% USD/HNL 26.79 ▲ 1.57% USD/NIO 36.62 ▲ 0.69% USD/VES 762.44 ▼ 0.13% USD/PAB 1.00 — 0.00% USD/BZD 2.00 — 0.00% USD/JMD 157.28 — 0.00% USD/TTD 6.70 ▲ 0.61% EUR/BRL 5.95 ▲ 1.01% BRENT 88.88 ▼ 0.03% WTI 83.11 ▼ 0.11% IRON ORE 161.91 — — COPPER 6.61 ▲ 0.03% GOLD 4,461 ▲ 1.78% SILVER 65.59 ▲ 1.26% SOY 1,184 ▲ 3.20% CORN 480.50 ▲ 10.02% WHEAT 655.00 ▲ 3.93% COFFEE 317.25 ▼ 5.51% SUGAR 16.43 ▼ 1.79% ORANGE JUICE 138.55 ▼ 0.47% COTTON 85.03 ▲ 2.33% COCOA 5,719 ▲ 3.18% BEEF 223.60 ▼ 3.93% CATTLE 339.10 ▼ 3.16% LITHIUM 75.20 ▲ 1.47% PETR4 41.64 ▼ 0.05% VALE3 72.97 ▲ 0.83% ITUB4 38.60 ▼ 1.03% BBDC4 16.85 ▲ 0.36% ABEV3 14.89 ▼ 0.80% BBAS3 19.37 ▲ 0.47% B3SA3 14.26 ▼ 0.21% WEGE3 47.59 ▲ 0.49% PRIO3 59.14 ▼ 0.19% SUZB3 41.33 ▲ 2.35% RENT3 34.68 ▼ 0.09% AZZA3 15.89 ▼ 2.63% CSAN3 3.22 ▼ 1.83% RAIZ4 0.25 — 0.00% PCAR3 2.75 ▼ 0.36% GMAT3 3.65 ▼ 1.08% PSSA3 48.13 ▼ 0.54% CVCB3 1.33 ▼ 2.92% POSI3 3.36 ▲ 2.44% SLCE3 13.34 ▲ 0.30% NATU3 8.14 ▼ 0.73%
since 2009
Thursday, September 10, 2026

Africa Central Africa

Sub-Saharan Africa Poised for 4% Growth in 2024

By · December 18, 2023 · 2 min read

Africa Intelligence

One email, every weekday morning. African markets, politics and business — filed from our newsroom in Rio.

Yesterday’s subject line: “Nigeria's Dangote signs for Africa's biggest IPO ever”

Free. We send a confirmation link first — nothing arrives until you click it. Unsubscribe with one click in any edition. If you stop opening us for 30 days we stop sending by ourselves, as we assume the interest is no longer there. See our privacy policy. We never share your email.

Fitch Ratings forecasts a 4% growth for Sub-Saharan Africa in 2024, signifying a steady economic progression.

This growth aligns with the five-year average up to 2019, although it’s slightly lower than the robust trend prior to 2014.

The analysis highlights a neutral trend in ratings for the region, indicating stable economic conditions.

Despite the overall average growth, there are notable variations among the 20 countries analyzed.

Seven of these countries are expected to grow at rates equal to or exceeding 5.5%, illustrating the diverse economic landscapes within the region.

Key risks identified include financing constraints, climatic events, and the possibility of slower global growth impacting African economies.

These factors underscore the interconnectedness of global and regional economic dynamics.
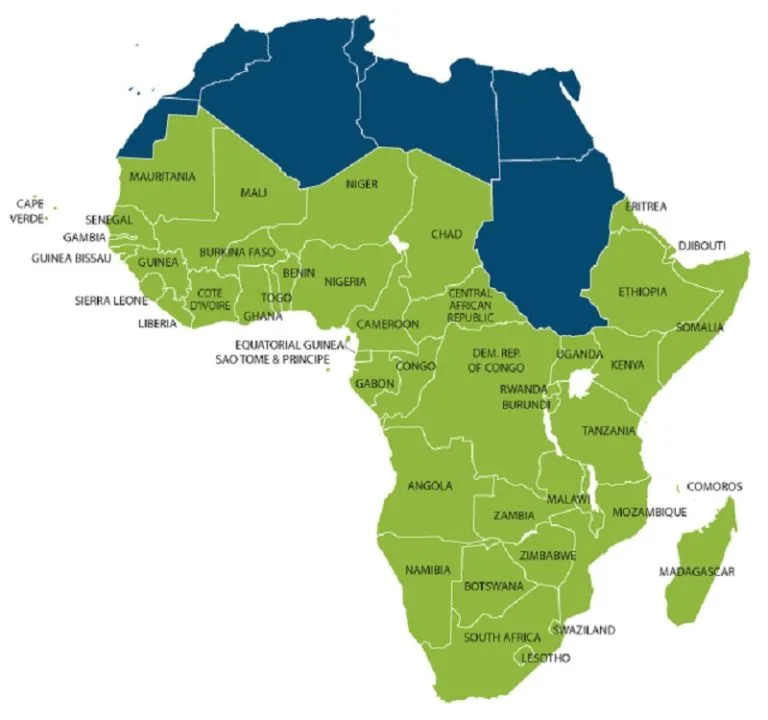
Sub-Saharan Africa Poised for 4% Growth in 2024.
One-stop reference
Company Intelligence
Every listed company in Latin America — financials, ownership and structure for 1,450+ companies across 26 exchanges, in one place.
Browse the directory →
RT
Ask Rio Times
17 years of Latin America reporting, on demand.
Open the full Ask Rio Times →

Inflation in the region is projected to slow down, decreasing from a high of 7.4% in 2022 to an anticipated 4.9% next year.

This expected decrease in inflation could contribute positively to economic stability across the region.

Regarding public debt, Fitch expects a stabilization of 67%.

This prediction is based on ongoing fiscal consolidation efforts supported by International Monetary Fund programs in many countries.

The stabilization reflects concerted efforts to manage fiscal challenges effectively.

Countries in the region have public debt exceeding 70% of their GDP

The debt-to-GDP ratio in this region is maintained at 67%, higher than pre-pandemic levels, indicating the long-term impact of the pandemic on the region’s economies.

This level of debt highlights the importance of continued fiscal management and economic reforms.

The report also notes that half of the Fitch-rated countries in the region have public debt exceeding 70% of their GDP.

This high debt ratio presents ongoing challenges and underscores the need for careful fiscal planning and management.

The analysis concludes that the average debt-to-revenue ratio will remain above 300%, suggesting that tax revenues cover only a third of debt servicing costs.

This statistic points to the ongoing need for economic reforms and efficient tax collection to ensure regional fiscal sustainability.

Part of our ongoing coverage

Africa: The New Scramble — the great-power contest over the continent.

More from Northern Africa

Read More from The Rio Times

The Rio Times · Power Map
See who really holds power in Latin America
Click to open the Power Map

Rotate for Best Experience

This report is optimized for landscape viewing. Rotate your phone for the full experience.