IBOV 192,114.55 ▲ 2.63% IPSA 10,916.59 ▲ 0.08% IPC MEX 64,531.68 ▲ 1.10% MERVAL 2,767,663 ▲ 0.32% COLCAP 2,515.02 ▼ 0.59% BVL PERÚ 59,751.67 ▲ 0.18% USD/BRL5.22▲ 0.09% USD/MXN18.15▼ 0.83% USD/CLP989.60▲ 0.35% USD/COP3,263▼ 1.50% USD/PEN3.43▼ 0.53% USD/ARS1,524▼ 0.04% USD/UYU40.46▲ 3.55% USD/PYG5,821▲ 2.69% USD/BOB11.93▲ 2.09% USD/DOP59.90▲ 0.67% USD/CRC456.38▲ 3.02% USD/GTQ7.64▲ 3.14% USD/HNL26.86▲ 3.19% USD/NIO36.62▲ 2.63% USD/VES864.39▼ 0.13% USD/PAB1.00— 0.00% USD/BZD2.00— 0.00% USD/JMD 157.28 — 0.00% USD/TTD6.69▲ 1.67% EUR/BRL5.87▲ 0.03% BRENT 88.88 ▼ 0.03% WTI 83.11 ▼ 0.11% IRON ORE 161.91 — — COPPER 6.61 ▲ 0.03% GOLD 4,461 ▲ 1.78% SILVER 65.59 ▲ 1.26% SOY 1,184 ▲ 3.20% CORN 480.50 ▲ 10.02% WHEAT 655.00 ▲ 3.93% COFFEE 317.25 ▼ 5.51% SUGAR 16.43 ▼ 1.79% ORANGE JUICE 138.55 ▼ 0.47% COTTON 85.03 ▲ 2.33% COCOA 5,719 ▲ 3.18% BEEF 223.60 ▼ 3.93% CATTLE 339.10 ▼ 3.16% LITHIUM 75.20 ▲ 1.47% PETR4 41.64 ▼ 0.05% VALE3 72.97 ▲ 0.83% ITUB4 38.60 ▼ 1.03% BBDC4 16.85 ▲ 0.36% ABEV3 14.89 ▼ 0.80% BBAS3 19.37 ▲ 0.47% B3SA3 14.26 ▼ 0.21% WEGE3 47.59 ▲ 0.49% PRIO3 59.14 ▼ 0.19% SUZB3 41.33 ▲ 2.35% RENT3 34.68 ▼ 0.09% AZZA3 15.89 ▼ 2.63% CSAN3 3.22 ▼ 1.83% RAIZ4 0.25 — 0.00% PCAR3 2.75 ▼ 0.36% GMAT3 3.65 ▼ 1.08% PSSA3 48.13 ▼ 0.54% CVCB3 1.33 ▼ 2.92% POSI3 3.36 ▲ 2.44% SLCE3 13.34 ▲ 0.30% NATU3 8.14 ▼ 0.73% IBOV 192,114.55 ▲ 2.63% IPSA 10,916.59 ▲ 0.08% IPC MEX 64,531.68 ▲ 1.10% MERVAL 2,767,663 ▲ 0.32% COLCAP 2,515.02 ▼ 0.59% BVL PERÚ 59,751.67 ▲ 0.18% USD/BRL 5.16 ▲ 0.01% USD/MXN 17.06 ▼ 0.24% USD/CLP 913.98 ▲ 0.04% USD/COP 3,140 ▲ 0.03% USD/PEN 3.36 ▼ 0.66% USD/ARS 1,493 ▲ 0.10% USD/UYU 40.27 ▲ 1.24% USD/PYG 5,939 ▲ 1.68% USD/BOB 11.64 ▼ 0.76% USD/DOP 58.34 ▲ 1.25% USD/CRC 445.92 ▲ 0.89% USD/GTQ 7.62 ▲ 2.21% USD/HNL 26.79 ▲ 1.57% USD/NIO 36.62 ▲ 0.69% USD/VES 762.44 ▼ 0.13% USD/PAB 1.00 — 0.00% USD/BZD 2.00 — 0.00% USD/JMD 157.28 — 0.00% USD/TTD 6.70 ▲ 0.61% EUR/BRL 5.95 ▲ 1.01% BRENT 88.88 ▼ 0.03% WTI 83.11 ▼ 0.11% IRON ORE 161.91 — — COPPER 6.61 ▲ 0.03% GOLD 4,461 ▲ 1.78% SILVER 65.59 ▲ 1.26% SOY 1,184 ▲ 3.20% CORN 480.50 ▲ 10.02% WHEAT 655.00 ▲ 3.93% COFFEE 317.25 ▼ 5.51% SUGAR 16.43 ▼ 1.79% ORANGE JUICE 138.55 ▼ 0.47% COTTON 85.03 ▲ 2.33% COCOA 5,719 ▲ 3.18% BEEF 223.60 ▼ 3.93% CATTLE 339.10 ▼ 3.16% LITHIUM 75.20 ▲ 1.47% PETR4 41.64 ▼ 0.05% VALE3 72.97 ▲ 0.83% ITUB4 38.60 ▼ 1.03% BBDC4 16.85 ▲ 0.36% ABEV3 14.89 ▼ 0.80% BBAS3 19.37 ▲ 0.47% B3SA3 14.26 ▼ 0.21% WEGE3 47.59 ▲ 0.49% PRIO3 59.14 ▼ 0.19% SUZB3 41.33 ▲ 2.35% RENT3 34.68 ▼ 0.09% AZZA3 15.89 ▼ 2.63% CSAN3 3.22 ▼ 1.83% RAIZ4 0.25 — 0.00% PCAR3 2.75 ▼ 0.36% GMAT3 3.65 ▼ 1.08% PSSA3 48.13 ▼ 0.54% CVCB3 1.33 ▼ 2.92% POSI3 3.36 ▲ 2.44% SLCE3 13.34 ▲ 0.30% NATU3 8.14 ▼ 0.73%
since 2009
Saturday, October 3, 2026

Spreading Prosperity: Brazil Sees Economic Shift from Big Cities

By · December 15, 2023 · 2 min read

Brazil’s economy is undergoing a transformation, as major cities wield less dominance in its GDP, a shift highlighted in a recent study by the Brazilian stats agency IBGE.

Previously, a few cities like São Paulo and Rio de Janeiro had a big share of the national wealth. The wealth is now spread more among many cities, says IBGE.

In 2002, four cities made up about a quarter of Brazil’s GDP. These were São Paulo, Rio de Janeiro, Brasília, and Belo Horizonte.

By 2021, 11 cities shared this quarter. The list grew to include Manaus, Curitiba, Osasco, Maricá, Porto Alegre, Guarulhos, and Fortaleza.

This change shows the economy is becoming less centralized. The study found more signs of this trend.

The LatAm Brief

One email, every weekday morning. What moved in Latin American markets, politics and expat life.

Yesterday’s subject line: “Brazil votes Sunday. A runoff follows if no one tops 50%”

Free. We send a confirmation link first — nothing arrives until you click it. Unsubscribe with one click in any edition. If you stop opening us for 30 days we stop sending by ourselves, as we assume the interest is no longer there. See our privacy policy. We never share your email.

In 2002, 48 cities combined to make up half of Brazil’s GDP. By 2021, it took 87 cities to reach the same level.
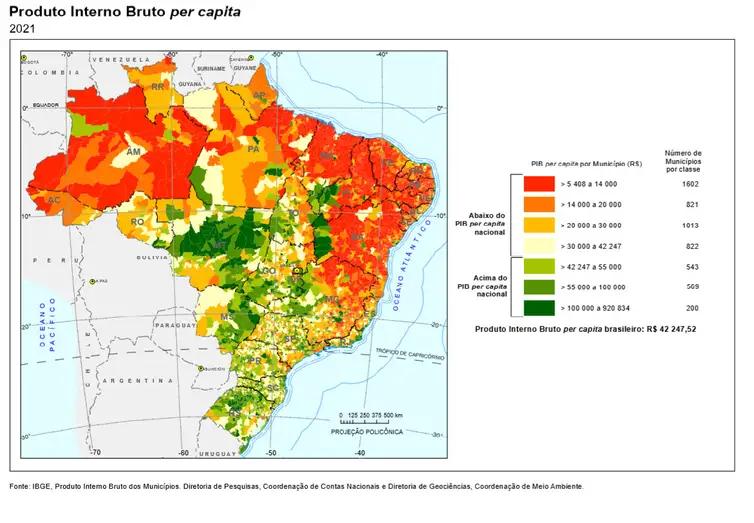
Spreading Prosperity: Brazil Sees Economic Shift from Big Cities - Green wealthy, red not wealthy.
Spreading Prosperity: Brazil Sees Economic Shift from Big Cities – Green wealthy, red not wealthy.
One-stop reference
Company Intelligence
Every listed company in Latin America — financials, ownership and structure for 1,450+ companies across 26 exchanges, in one place.
Browse the directory →
RT
Ask Rio Times
17 years of Latin America reporting, on demand.
Open the full Ask Rio Times →

This means the wealth is more evenly spread across the country. There’s also a shift in smaller towns.

In 2002, over 1,300 towns barely contributed to the GDP. By 2021, fewer towns were in this group. This shows the economy is growing in more areas.

Capital cities are also changing. In 2002, they were a big part of the economy. By 2021, their share dropped.

This is the lowest it’s been since 2002. The COVID-19 pandemic affected this. It hit services in capital cities hard.

Not all capitals are the wealthiest

Not all capitals are the wealthiest in their states. Other cities are richer in Pará, Espírito Santo, and Santa Catarina.

For example, Parauapebas leads in Pará, not the capital. This shows that wealth is spreading beyond the capitals.

From 2002 to 2021, São Paulo and Rio de Janeiro saw their GDP shares drop. This happened because key industries like finance and insurance slowed down.

But, some cities like Maricá saw growth, thanks to oil and gas. The study also looked at per capita GDP. This measures wealth per person.
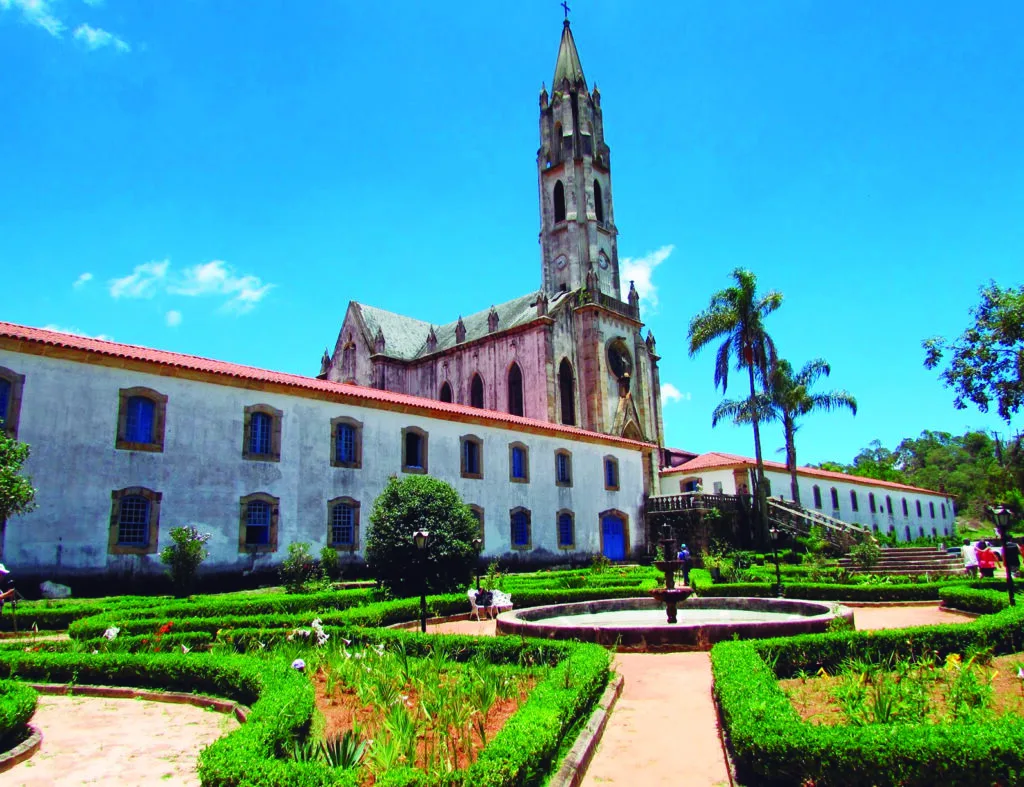
Catas Altas in Minas Gerais has the highest GDP per person in Brazil.

It found big differences across Brazil. Some small mining towns have high per capita GDP. But, overall, there’s a big range across the country.

In summary, Brazil’s economy is becoming more diverse. Wealth is not just in big cities anymore.

It’s spreading to more places across the country. This is good for balancing the economy.

This article was produced by The Rio Times’ automated newsroom system. How we use AI · Report an error · Editorial responsibility: Matthias Camenzind, Editor-in-Chief

The Rio Times · Power Map
See who really holds power in Latin America
Click to open the Power Map →

Rotate for Best Experience

This report is optimized for landscape viewing. Rotate your phone for the full experience.