IBOV 185,147.15 ▼ 0.02% IPSA 11,315.26 ▼ 1.14% IPC MEX 64,866.61 ▼ 0.87% MERVAL 3,049,121 ▼ 0.29% COLCAP 2,544.56 ▲ 0.40% BVL PERÚ 59,978.22 ▼ 0.31% USD/BRL5.12▼ 0.03% USD/MXN16.90▲ 0.10% USD/CLP933.68— 0.00% USD/COP3,124▼ 1.12% USD/PEN3.35▼ 0.34% USD/ARS1,509▲ 0.01% USD/UYU40.24▲ 1.33% USD/PYG5,947▲ 1.88% USD/BOB12.40▲ 3.56% USD/DOP59.00▲ 0.85% USD/CRC448.67▲ 1.78% USD/GTQ7.63▲ 2.28% USD/HNL26.84▲ 0.28% USD/NIO36.62— 0.00% USD/VES805.37▼ 0.90% USD/PAB1.00— 0.00% USD/BZD2.00— 0.00% USD/JMD 157.28 — 0.00% USD/TTD6.71▲ 1.02% EUR/BRL5.95▲ 0.91% BRENT 88.88 ▼ 0.03% WTI 83.11 ▼ 0.11% IRON ORE 161.91 — — COPPER 6.61 ▲ 0.03% GOLD 4,461 ▲ 1.78% SILVER 65.59 ▲ 1.26% SOY 1,184 ▲ 3.20% CORN 480.50 ▲ 10.02% WHEAT 655.00 ▲ 3.93% COFFEE 317.25 ▼ 5.51% SUGAR 16.43 ▼ 1.79% ORANGE JUICE 138.55 ▼ 0.47% COTTON 85.03 ▲ 2.33% COCOA 5,719 ▲ 3.18% BEEF 223.60 ▼ 3.93% CATTLE 339.10 ▼ 3.16% LITHIUM 75.20 ▲ 1.47% PETR4 41.64 ▼ 0.05% VALE3 72.97 ▲ 0.83% ITUB4 38.60 ▼ 1.03% BBDC4 16.85 ▲ 0.36% ABEV3 14.89 ▼ 0.80% BBAS3 19.37 ▲ 0.47% B3SA3 14.26 ▼ 0.21% WEGE3 47.59 ▲ 0.49% PRIO3 59.14 ▼ 0.19% SUZB3 41.33 ▲ 2.35% RENT3 34.68 ▼ 0.09% AZZA3 15.89 ▼ 2.63% CSAN3 3.22 ▼ 1.83% RAIZ4 0.25 — 0.00% PCAR3 2.75 ▼ 0.36% GMAT3 3.65 ▼ 1.08% PSSA3 48.13 ▼ 0.54% CVCB3 1.33 ▼ 2.92% POSI3 3.36 ▲ 2.44% SLCE3 13.34 ▲ 0.30% NATU3 8.14 ▼ 0.73% IBOV 185,147.15 ▼ 0.02% IPSA 11,315.26 ▼ 1.14% IPC MEX 64,866.61 ▼ 0.87% MERVAL 3,049,121 ▼ 0.29% COLCAP 2,544.56 ▲ 0.40% BVL PERÚ 59,978.22 ▼ 0.31% USD/BRL 5.16 ▲ 0.01% USD/MXN 17.06 ▼ 0.24% USD/CLP 913.98 ▲ 0.04% USD/COP 3,140 ▲ 0.03% USD/PEN 3.36 ▼ 0.66% USD/ARS 1,493 ▲ 0.10% USD/UYU 40.27 ▲ 1.24% USD/PYG 5,939 ▲ 1.68% USD/BOB 11.64 ▼ 0.76% USD/DOP 58.34 ▲ 1.25% USD/CRC 445.92 ▲ 0.89% USD/GTQ 7.62 ▲ 2.21% USD/HNL 26.79 ▲ 1.57% USD/NIO 36.62 ▲ 0.69% USD/VES 762.44 ▼ 0.13% USD/PAB 1.00 — 0.00% USD/BZD 2.00 — 0.00% USD/JMD 157.28 — 0.00% USD/TTD 6.70 ▲ 0.61% EUR/BRL 5.95 ▲ 1.01% BRENT 88.88 ▼ 0.03% WTI 83.11 ▼ 0.11% IRON ORE 161.91 — — COPPER 6.61 ▲ 0.03% GOLD 4,461 ▲ 1.78% SILVER 65.59 ▲ 1.26% SOY 1,184 ▲ 3.20% CORN 480.50 ▲ 10.02% WHEAT 655.00 ▲ 3.93% COFFEE 317.25 ▼ 5.51% SUGAR 16.43 ▼ 1.79% ORANGE JUICE 138.55 ▼ 0.47% COTTON 85.03 ▲ 2.33% COCOA 5,719 ▲ 3.18% BEEF 223.60 ▼ 3.93% CATTLE 339.10 ▼ 3.16% LITHIUM 75.20 ▲ 1.47% PETR4 41.64 ▼ 0.05% VALE3 72.97 ▲ 0.83% ITUB4 38.60 ▼ 1.03% BBDC4 16.85 ▲ 0.36% ABEV3 14.89 ▼ 0.80% BBAS3 19.37 ▲ 0.47% B3SA3 14.26 ▼ 0.21% WEGE3 47.59 ▲ 0.49% PRIO3 59.14 ▼ 0.19% SUZB3 41.33 ▲ 2.35% RENT3 34.68 ▼ 0.09% AZZA3 15.89 ▼ 2.63% CSAN3 3.22 ▼ 1.83% RAIZ4 0.25 — 0.00% PCAR3 2.75 ▼ 0.36% GMAT3 3.65 ▼ 1.08% PSSA3 48.13 ▼ 0.54% CVCB3 1.33 ▼ 2.92% POSI3 3.36 ▲ 2.44% SLCE3 13.34 ▲ 0.30% NATU3 8.14 ▼ 0.73%
since 2009
Sunday, September 6, 2026

Mexico China

Mexico Outpaces China in U.S. Imports After 20 Years

By · February 8, 2024 · 2 min read

Daily Brief

The morning intel from across Latin America. Free.

By subscribing you agree to our privacy policy. We never share your email.

In a significant turn of events, the U.S. imported more goods from Mexico than from China in 2023, a first in two decades.

This shift signifies a major change in global trade dynamics, aligning with the U.S.’s “friendshoring” strategy.

This approach aims to diversify supply chains to allied nations, reducing dependence on Chinese imports due to increasing competition and security tensions.

The US trade deficit experienced a significant decline, reaching its lowest point in three years at $773.4 billion, a drop of 18.7% from the previous year.

This reduction was mainly due to a decrease in goods imports, outpacing a fall in exports, while service exports increased.

The trade gap with Mexico widened to $152.4 billion, with imports from Mexico climbing to $475.6 billion, overtaking China’s $427.2 billion.
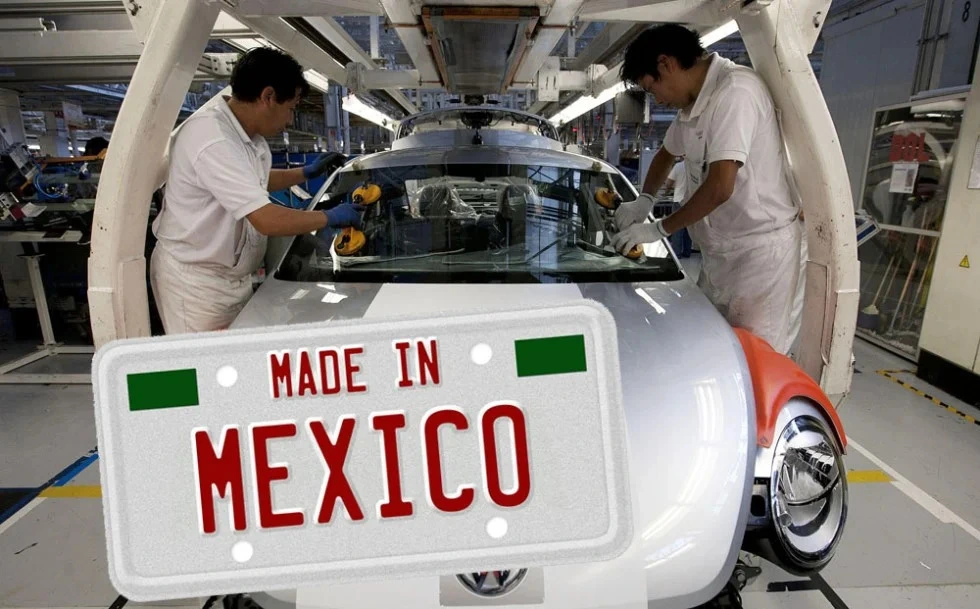
Mexico Outpaces China in U.S. Imports After 20 Years.
One-stop reference
Company Intelligence
Every listed company in Latin America — financials, ownership and structure for 1,450+ companies across 26 exchanges, in one place.
Browse the directory →
RT
Ask Rio Times
17 years of Latin America reporting, on demand.
Open the full Ask Rio Times →

This realignment reflects the evolving role of economic and security factors in shaping trade, emphasizing stronger ties with trusted partners.

It suggests a strategic shift in U.S. trade priorities, focusing on enhancing economic relations with neighboring countries.

The change also points to an expected moderation in trade flows amid forecasts of slower demand and growth both domestically and internationally.

Despite this, the U.S. economy’s resilience, bolstered by consumer spending, has maintained economic momentum.

However, rising interest rates could dampen consumer spending and affect imports.

For President Joe Biden’s administration, this development is a positive sign, especially as his re-election campaign progresses.

It illustrates a successful navigation of global trade complexities and a commitment to securing America’s economic interests through strategic trade adjustments.

This article was produced by The Rio Times’ automated newsroom system. How we use AI · Report an error

Read More from The Rio Times

The Rio Times · Power Map
See who really holds power in Latin America
Click to open the Power Map

Rotate for Best Experience

This report is optimized for landscape viewing. Rotate your phone for the full experience.