IBOV 177,583.27 ▲ 1.09% IPSA 11,347.98 ▼ 0.86% IPC MEX 65,048.39 ▼ 0.67% MERVAL 2,999,080 ▲ 0.66% COLCAP 2,467.23 ▲ 0.38% BVL PERÚ 59,928.30 ▼ 0.14% USD/BRL5.18▼ 0.17% USD/MXN16.99▼ 0.27% USD/CLP934.76▲ 0.35% USD/COP3,217▲ 0.53% USD/PEN3.37▲ 0.54% USD/ARS1,509▼ 0.28% USD/UYU40.29▲ 0.05% USD/PYG5,892▼ 0.13% USD/BOB11.84▲ 0.51% USD/DOP58.64▲ 0.05% USD/CRC446.47▼ 0.04% USD/GTQ7.62▼ 0.02% USD/HNL26.84— 0.00% USD/NIO36.62— 0.00% USD/VES793.00▼ 0.13% USD/PAB1.00— 0.00% USD/BZD2.00— 0.00% USD/JMD 157.28 — 0.00% USD/TTD6.69▼ 0.37% EUR/BRL6.02▼ 0.11% BRENT 88.88 ▼ 0.03% WTI 83.11 ▼ 0.11% IRON ORE 161.91 — — COPPER 6.61 ▲ 0.03% GOLD 4,461 ▲ 1.78% SILVER 65.59 ▲ 1.26% SOY 1,184 ▲ 3.20% CORN 480.50 ▲ 10.02% WHEAT 655.00 ▲ 3.93% COFFEE 317.25 ▼ 5.51% SUGAR 16.43 ▼ 1.79% ORANGE JUICE 138.55 ▼ 0.47% COTTON 85.03 ▲ 2.33% COCOA 5,719 ▲ 3.18% BEEF 223.60 ▼ 3.93% CATTLE 339.10 ▼ 3.16% LITHIUM 75.20 ▲ 1.47% PETR4 41.64 ▼ 0.05% VALE3 72.97 ▲ 0.83% ITUB4 38.60 ▼ 1.03% BBDC4 16.85 ▲ 0.36% ABEV3 14.89 ▼ 0.80% BBAS3 19.37 ▲ 0.47% B3SA3 14.26 ▼ 0.21% WEGE3 47.59 ▲ 0.49% PRIO3 59.14 ▼ 0.19% SUZB3 41.33 ▲ 2.35% RENT3 34.68 ▼ 0.09% AZZA3 15.89 ▼ 2.63% CSAN3 3.22 ▼ 1.83% RAIZ4 0.25 — 0.00% PCAR3 2.75 ▼ 0.36% GMAT3 3.65 ▼ 1.08% PSSA3 48.13 ▼ 0.54% CVCB3 1.33 ▼ 2.92% POSI3 3.36 ▲ 2.44% SLCE3 13.34 ▲ 0.30% NATU3 8.14 ▼ 0.73% IBOV 177,583.27 ▲ 1.09% IPSA 11,347.98 ▼ 0.86% IPC MEX 65,048.39 ▼ 0.67% MERVAL 2,999,080 ▲ 0.66% COLCAP 2,467.23 ▲ 0.38% BVL PERÚ 59,928.30 ▼ 0.14% USD/BRL 5.16 ▲ 0.01% USD/MXN 17.06 ▼ 0.24% USD/CLP 913.98 ▲ 0.04% USD/COP 3,140 ▲ 0.03% USD/PEN 3.36 ▼ 0.66% USD/ARS 1,493 ▲ 0.10% USD/UYU 40.27 ▲ 1.24% USD/PYG 5,939 ▲ 1.68% USD/BOB 11.64 ▼ 0.76% USD/DOP 58.34 ▲ 1.25% USD/CRC 445.92 ▲ 0.89% USD/GTQ 7.62 ▲ 2.21% USD/HNL 26.79 ▲ 1.57% USD/NIO 36.62 ▲ 0.69% USD/VES 762.44 ▼ 0.13% USD/PAB 1.00 — 0.00% USD/BZD 2.00 — 0.00% USD/JMD 157.28 — 0.00% USD/TTD 6.70 ▲ 0.61% EUR/BRL 5.95 ▲ 1.01% BRENT 88.88 ▼ 0.03% WTI 83.11 ▼ 0.11% IRON ORE 161.91 — — COPPER 6.61 ▲ 0.03% GOLD 4,461 ▲ 1.78% SILVER 65.59 ▲ 1.26% SOY 1,184 ▲ 3.20% CORN 480.50 ▲ 10.02% WHEAT 655.00 ▲ 3.93% COFFEE 317.25 ▼ 5.51% SUGAR 16.43 ▼ 1.79% ORANGE JUICE 138.55 ▼ 0.47% COTTON 85.03 ▲ 2.33% COCOA 5,719 ▲ 3.18% BEEF 223.60 ▼ 3.93% CATTLE 339.10 ▼ 3.16% LITHIUM 75.20 ▲ 1.47% PETR4 41.64 ▼ 0.05% VALE3 72.97 ▲ 0.83% ITUB4 38.60 ▼ 1.03% BBDC4 16.85 ▲ 0.36% ABEV3 14.89 ▼ 0.80% BBAS3 19.37 ▲ 0.47% B3SA3 14.26 ▼ 0.21% WEGE3 47.59 ▲ 0.49% PRIO3 59.14 ▼ 0.19% SUZB3 41.33 ▲ 2.35% RENT3 34.68 ▼ 0.09% AZZA3 15.89 ▼ 2.63% CSAN3 3.22 ▼ 1.83% RAIZ4 0.25 — 0.00% PCAR3 2.75 ▼ 0.36% GMAT3 3.65 ▼ 1.08% PSSA3 48.13 ▼ 0.54% CVCB3 1.33 ▼ 2.92% POSI3 3.36 ▲ 2.44% SLCE3 13.34 ▲ 0.30% NATU3 8.14 ▼ 0.73%
since 2009
Monday, August 31, 2026

Eurozone Records €10 Billion Trade Surplus in September

By · November 15, 2023 · 2 min read

Daily Brief

The morning intel from across Latin America. Free.

By subscribing you agree to our privacy policy. We never share your email.

In September 2023, the Eurozone reported a significant trade surplus of €10 billion, a stark contrast to the €36.6 billion deficit recorded in the same month of 2022.

The European Union’s statistical office, Eurostat, released these figures on Wednesday, November 15, 2023.

The report shows a significant shift in the Eurozone’s trade dynamics. Exports for September 2023 were €235.8 billion.

This marks a 9.3% decrease from €260.1 billion in September of the previous year.

Imports also declined, falling to €225.8 billion. This is 23.9% lower than the €296.7 billion recorded in September 2022.

Cumulatively, from January to September 2023, the Eurozone saw a trade surplus of €16.3 billion.

This is a major improvement, considering the €278.3 billion deficit during the same period in the previous year.

This development indicates a positive trend in the Eurozone’s trade balance. It reflects a recovery and resilience in the region’s economic activities.
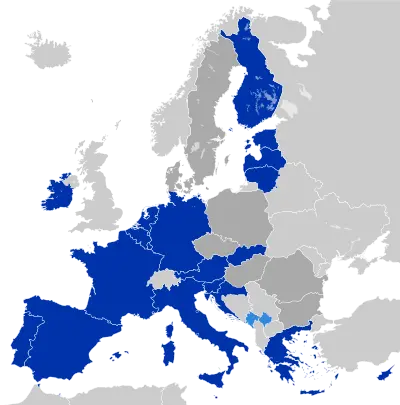
Eurozone Records €10 Billion Trade Surplus in September. (Photo Intternet reproduction)
One-stop reference
Company Intelligence
Every listed company in Latin America — financials, ownership and structure for 1,450+ companies across 26 exchanges, in one place.
Browse the directory →
RT
Ask Rio Times
17 years of Latin America reporting, on demand.
Open the full Ask Rio Times →

The data is a key indicator of the Eurozone’s economic health and will be closely monitored for future trends.

The recent trade surplus is a sign of economic recovery in the Eurozone, particularly after the challenges of recent years.

Historically, the Eurozone has experienced fluctuations in its trade balance, influenced by global economic conditions.

This surplus is significant when compared to the global economic downturn experienced in previous years.

Globally, many regions are still grappling with economic recovery, making the Eurozone’s achievement noteworthy.

For instance, some major economies are still facing trade deficits, highlighting the Eurozone’s relative success.

Background

The decline in imports suggests a shift in consumption patterns or improved domestic production within the Eurozone.

This could be a strategic move to strengthen internal markets and reduce dependency on external goods.

The data also suggests increased competitiveness of Eurozone exports despite the decrease in volume.

This could be due to higher value products or favorable exchange rates, enhancing the region’s export appeal.

Economists and policymakers are likely to study the Eurozone’s approach as a model for balancing trade. The region’s strategy could offer insights for other economies aiming to achieve a healthier trade balance.

This positive trade balance could boost investor confidence in the Eurozone, potentially attracting more foreign investment. Overall, the Eurozone’s trade surplus marks a key milestone in its economic trajectory, setting a precedent for future growth and stability.

This article was produced by The Rio Times’ automated newsroom system. How we use AI · Report an error

Read More from The Rio Times

The Rio Times · Power Map
See who really holds power in Latin America
Click to open the Power Map

Rotate for Best Experience

This report is optimized for landscape viewing. Rotate your phone for the full experience.