The global copper market is showing signs of a surplus for the upcoming year, evident in its current pricing trends.
On Wednesday, the London Metal Exchange LME recorded spot copper trading at a $93.25 per ton discount to the three-month reference contract.
This significant gap, the widest since the 1990s, signals an abundant metal supply, a condition known as contango.
At a major industry event in Shanghai, market players presented mixed views for 2024.
Many anticipate an increase in the surplus of refined metal, even as mining production faces constraints.
This year, China experienced a rise in new smelting operations.
Copper’s critical role in manufacturing and clean energy technologies, including electric vehicles and solar power, remains undiminished.
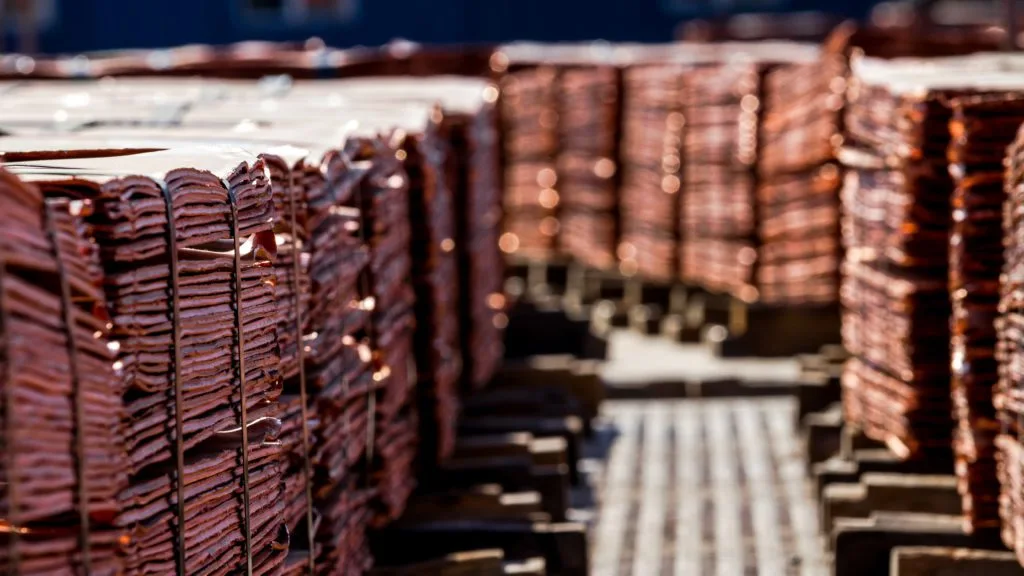
Despite these market conditions, copper’s benchmark price maintained strength in the second half of 2023.
On Wednesday, it reached the highest closing on the London Metal Exchange since September.
This surge was influenced by a weaker dollar and the expectation that the U.S. Federal Reserve might pause its intense monetary tightening.
China’s strong demand has been a key support factor, with Codelco’s Chairman Máximo Pacheco noting the rapid growth in China’s new energy sectors.
Nevertheless, global production slowdowns and increasing stockpiles continue to challenge copper’s price stability.
The bearish signal in the copper market reflects broader economic trends and commodity cycles.
Historically, copper has been a reliable indicator of global economic health, often termed ‘Dr. Copper’ due to its ability to predict economic trends.
The current surplus and price contango suggest a global slowdown in industrial activity and construction, sectors where copper is heavily used.
China, as the world’s largest consumer of copper, plays a crucial role in determining global copper prices.
The recent expansion in Chinese smelting capacity, coupled with their aggressive push into clean energy technologies, indicates a potential shift in copper demand dynamics.
However, the current surplus challenges this narrative, pointing towards a mismatch between supply and anticipated demand.
Background
The contrast between the strong benchmark price and the market’s contango position is unusual.
It suggests that while immediate supply is ample, there may be longer-term expectations of a market tightening, possibly due to future demand in clean energy sectors.
The U.S. Federal Reserve’s monetary policy and the strength of the dollar also significantly impact commodity prices, including copper.
A weaker dollar typically makes commodities priced in dollars more attractive to holders of other currencies, potentially propping up prices.
Globally, copper’s role in the transition to renewable energy and electric vehicles cannot be understated.
As these sectors grow, copper’s long-term demand is likely to increase, potentially offsetting current surplus concerns.
The copper market’s behavior serves as a case study for commodity markets in a changing global economy.
It highlights the importance of monitoring supply-demand dynamics, geopolitical influences, and technological shifts in understanding commodity price movements.
More: Brazil news in English, every day from The Rio Times.
Live Market IntelligenceBrazil — Live Market Board
Rio Times · Live Market Intelligence
Brazil — Live Market Board
-0.52%
205,429.42
-0.52%
70,249.54
+1.43%
10,894.41
-0.83%
3,017,221
—
2,524.78
-1.39%
59,561.23
-1.85%
| Instrument | Last | Change | YoY | Prev. | High | Low | Volume |
|---|---|---|---|---|---|---|---|
| IBOV | 205,429.42 | -0.52% | +21.85% | 206,495.23 | 168,310 | 167,142 | — |
| USD/BRL | 5.16 | +0.01% | -5.13% | 5.16 | 5.18 | 5.14 | — |
| SELIC | 14.00% | — | — | — | — | — | |
| PETR4 | 41.64 | -0.05% | +35.19% | 41.66 | 41.97 | 41.15 | 41,499,400 |
| VALE3 | 72.97 | +0.83% | +30.75% | 72.37 | 73.54 | 72.66 | 17,658,000 |
| ITUB4 | 38.60 | -1.03% | +4.57% | 39.00 | 39.34 | 38.39 | 29,487,800 |
| BBDC4 | 16.85 | +0.36% | +3.50% | 16.79 | 16.90 | 16.67 | 19,416,900 |
| BBAS3 | 19.37 | +0.47% | +0.73% | 19.28 | 19.44 | 19.16 | 11,069,200 |
| B3SA3 | 14.26 | -0.21% | +12.73% | 14.29 | 14.47 | 14.11 | 33,037,800 |
| ABEV3 | 14.89 | -0.80% | +21.91% | 15.01 | 15.07 | 14.81 | 16,453,100 |
| WEGE3 | 47.59 | +0.49% | +29.99% | 47.36 | 48.08 | 47.36 | 3,364,600 |
| PRIO3 | 59.14 | -0.19% | +50.67% | 59.25 | 59.81 | 58.74 | 3,325,600 |
| SUZB3 | 41.33 | +2.35% | -23.55% | 40.38 | 41.48 | 40.35 | 3,914,900 |
| RENT3 | 34.68 | -0.09% | +0.84% | 34.71 | 34.96 | 34.35 | 7,979,100 |
| AZZA3 | 15.89 | -2.63% | -53.76% | 16.32 | 16.42 | 15.82 | 1,330,300 |
| CSNA3 | 4.30 | +0.47% | -42.65% | 4.28 | 4.41 | 4.26 | 10,076,100 |
| GGBR4 | 24.69 | +2.19% | +51.38% | 24.16 | 24.85 | 24.18 | 7,047,600 |
| ENEV3 | 24.21 | -1.38% | +70.49% | 24.55 | 24.64 | 23.99 | 9,297,000 |
This article was produced by The Rio Times’ automated newsroom system. How we use AI · Report an error · Editorial responsibility: Matthias Camenzind, Editor-in-Chief
Copper in Latin America
- Copper in Latin America 2026: Mines, Prices and Politics
- Chile’s State Copper Giant Codelco Explained
- Peru Copper Mining Explained: Output, Big Mines, Exports and Risks in 2026
- Peru Natural Resources Explained 2026